
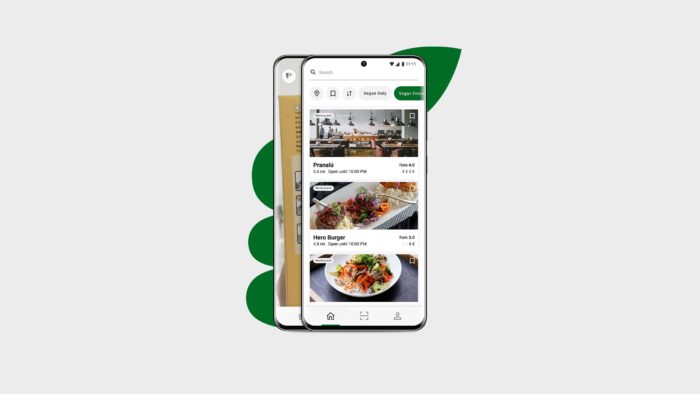
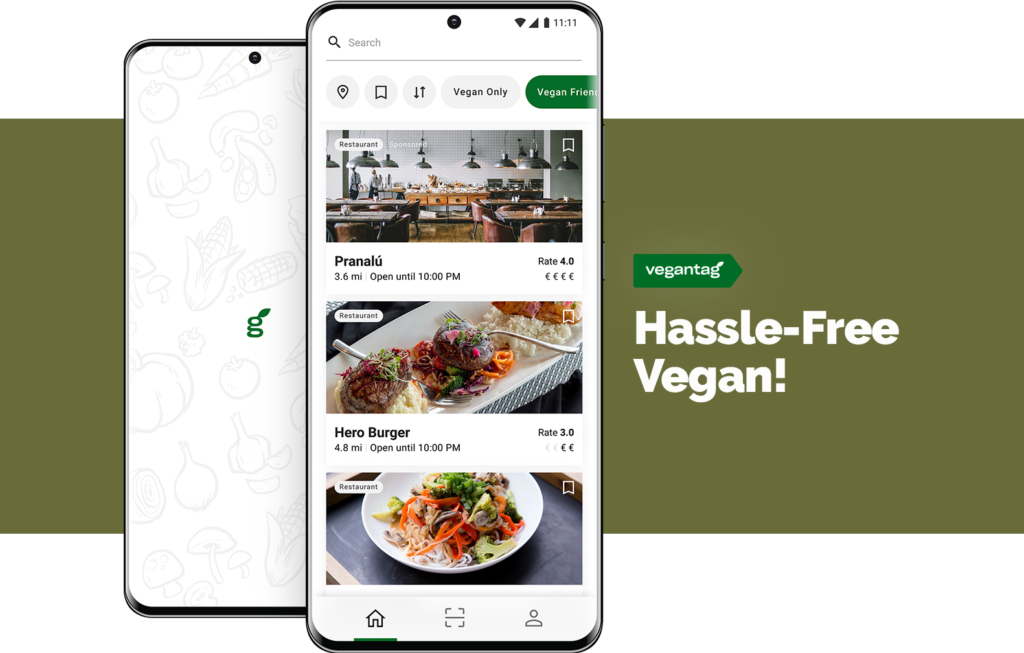
VeganTag provides essential information for making clean living choices and helps a hassle-free switch to a vegan/plant-based diet.
TOOLS: Notion, InVision, Google Docs, Miro, Figma, Flinto, Lookback
DURATION: Feb – Jun 2020 (Part-time)
UX TEAM: T. Gaikwad, J. Šević, N. Tavalaei

1. Research & Strategy
OBJECTIVE: VeganTag wants to understand the pain points and concerns of vegans in Barcelona.
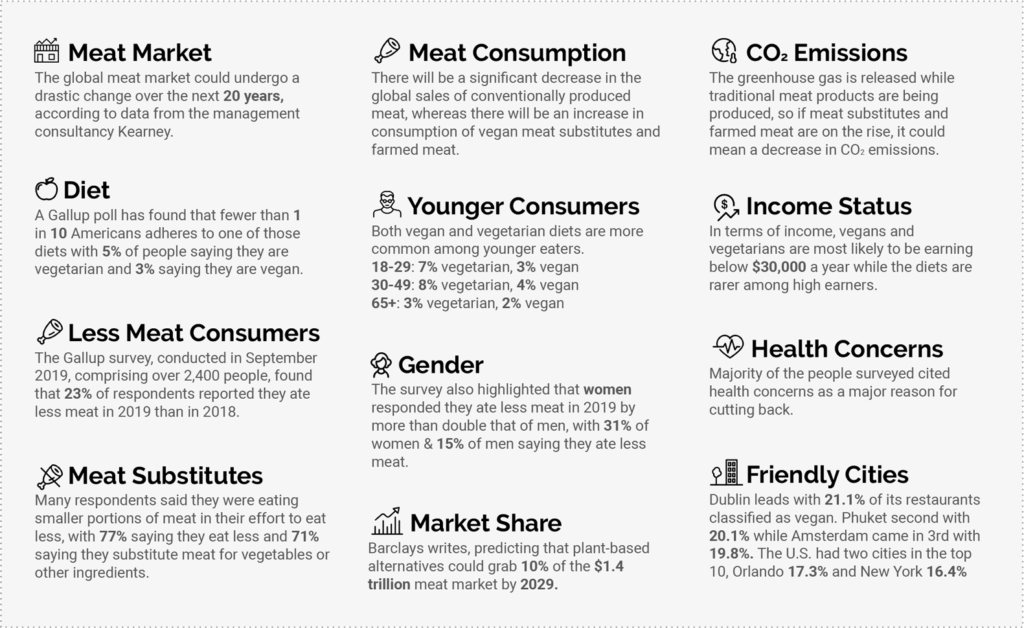
1.1 Desk Research
The UX Team carried out desk research to understand the competition in the vegan market and gauge the current scenario about veganism in the world.
1.2 Interviews
During the second phase of the research, the UX Team moved ahead with several comprehensive interviews, conducted with 5 vegans, 2 vegetarians, and 1 flexitarian. Including vegetarians and flexitarians in qualitative research was intended to bring a richer, more in-depth understanding of veganism.
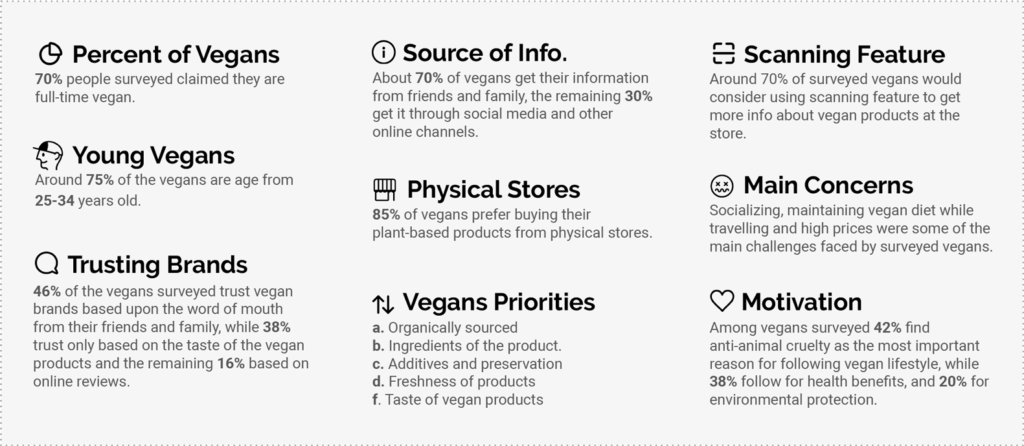
1.3 Survey
In the third phase of the research, we conducted an online survey to validate the hypothesis on a larger scale (62 participants).
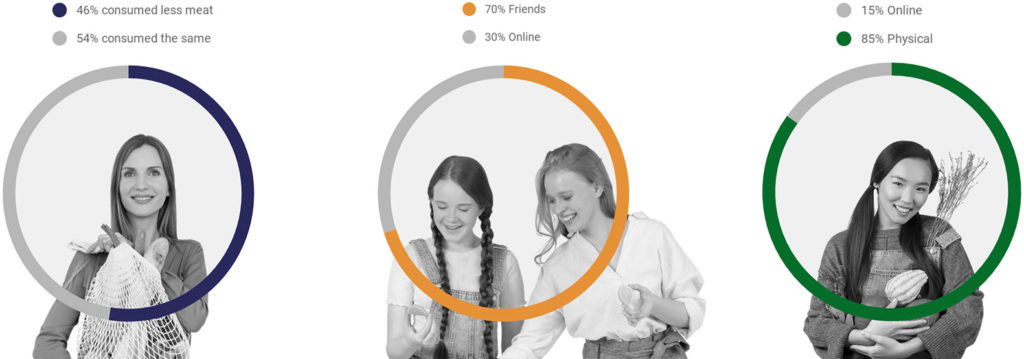
1.4 Key Findings
- 46% of the surveyed people consumed less meat in 2019, the number of women exceeded men by more than double
- About 70% of vegans get their information from friends and family, the remaining 30% get it through social media and other online channels.
- 85% of vegans prefer buying their plant-based products from physical stores.
1.5 Output
As an output of the research phase, we created User Personas (1.5.1), User Journey (1.5.2), Empathy Map (1.5.3), and Value Proposition Canvas (1.5.4).
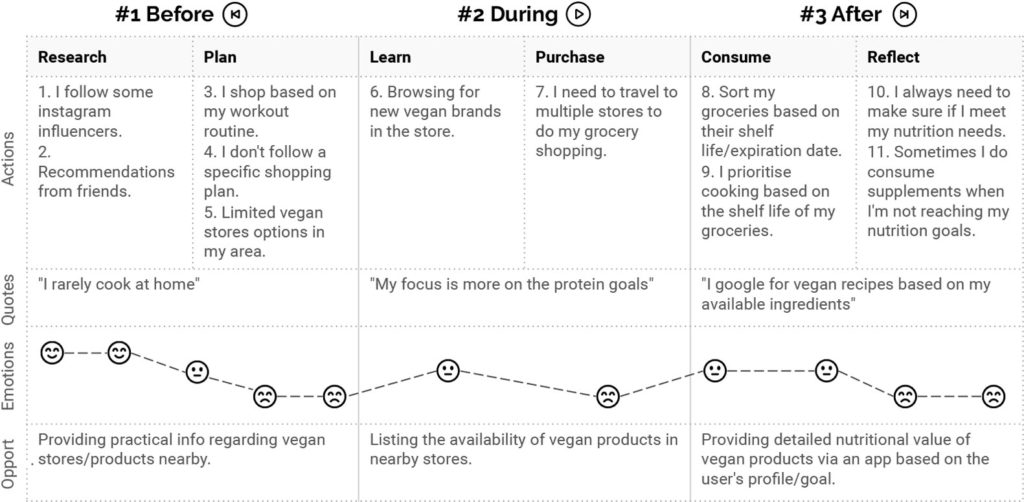
1.5.2 User Journey
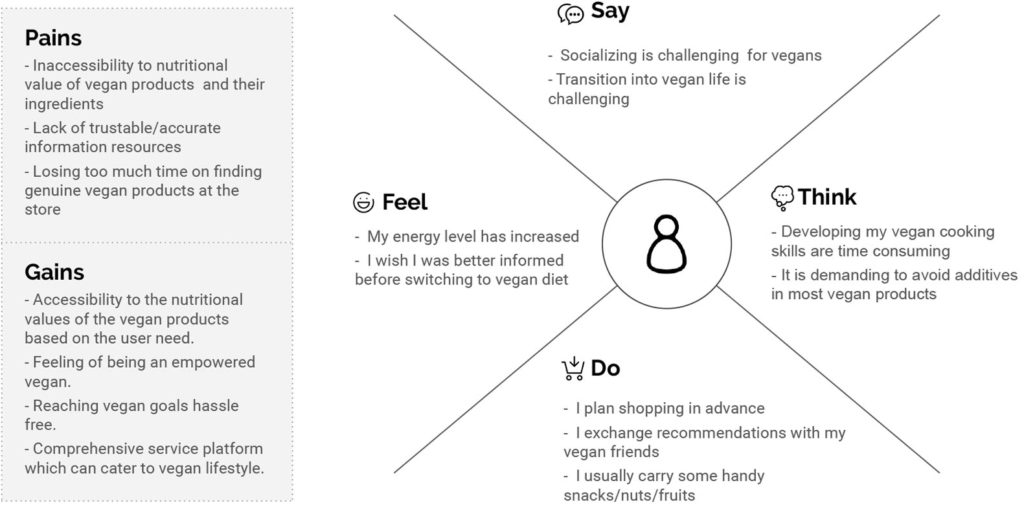
1.5.3 Empathy Map
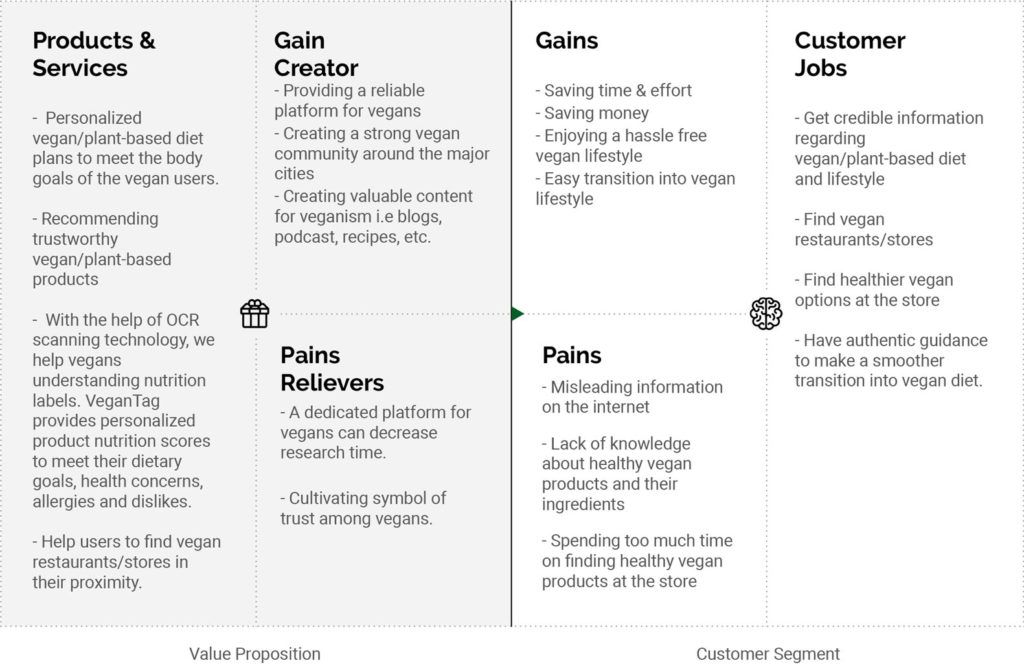
1.5.4 Value Proposition Canvas

2. Solution Definition
EPIC: As a vegan customer, I want to have access to a credible source of information in the least amount of time so that I can reach my goals.
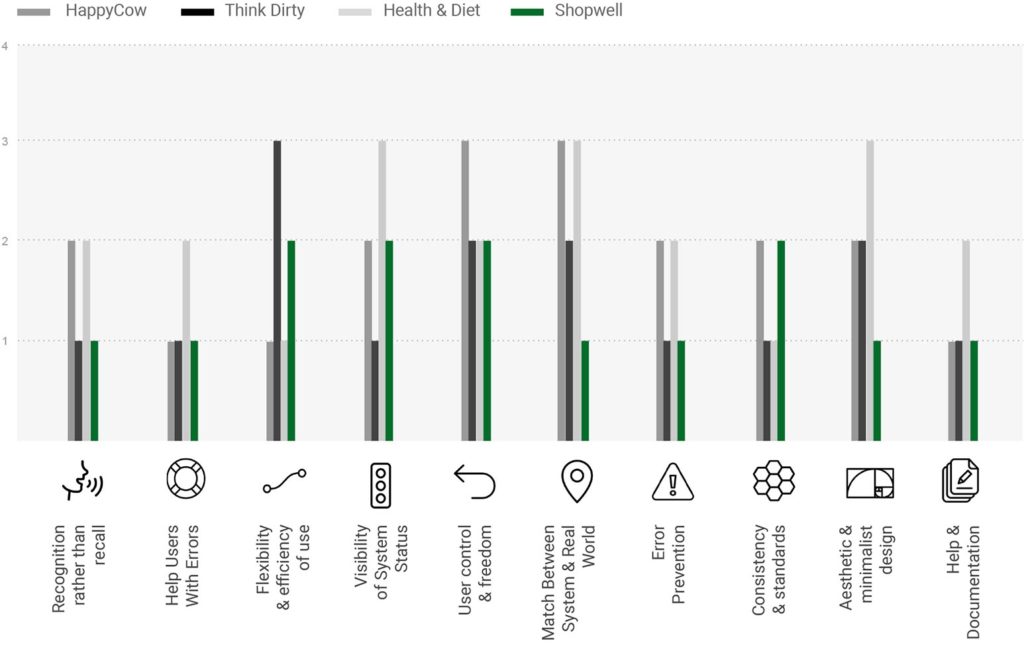
2.1 Benchmarking UX
We carried out a heuristic evaluation of the best competitive Android apps (similar AoI and/or technology), to be able to detect common patterns, features, and usability problems. This process helped us recognizing the market gap, and defining our competitive advantage.
The following 0 to 4 rating scale can be used to rate the severity of usability problems:
0 = I don’t agree that this is a usability problem at all
1 = Cosmetic problem only: need not be fixed unless extra time is available on the project
2 = Minor usability problem: fixing this should be given low priority
3 = Major usability problem: important to fix, so should be given high priority
4 = Usability catastrophe: imperative to fix this before the product can be released
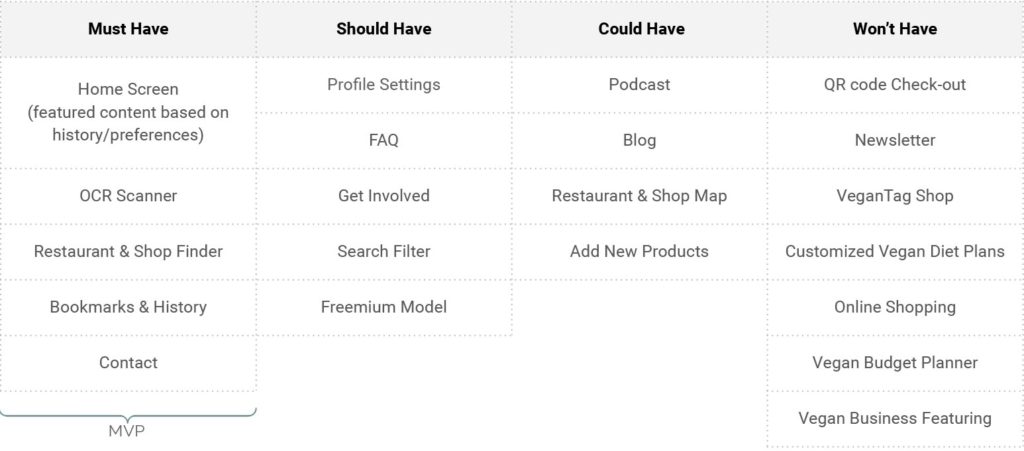
2.2 MoSCoW Prioritization
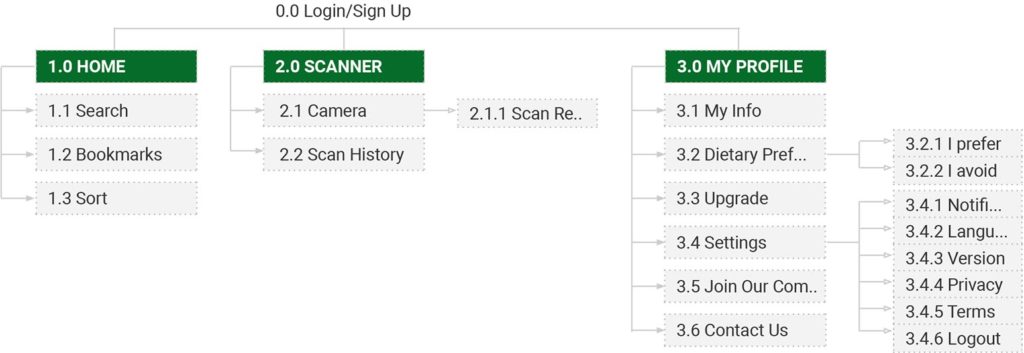
2.3 Information Architecture
2.4 User Task Flow
2.4.1 Task A: Getting a direction for a specific Vegan Friendly (Vegan/Opt) restaurant

2.4.2 Task B: Scanning a product and getting the information

2.4.3 Task C: Entering dietary preferences


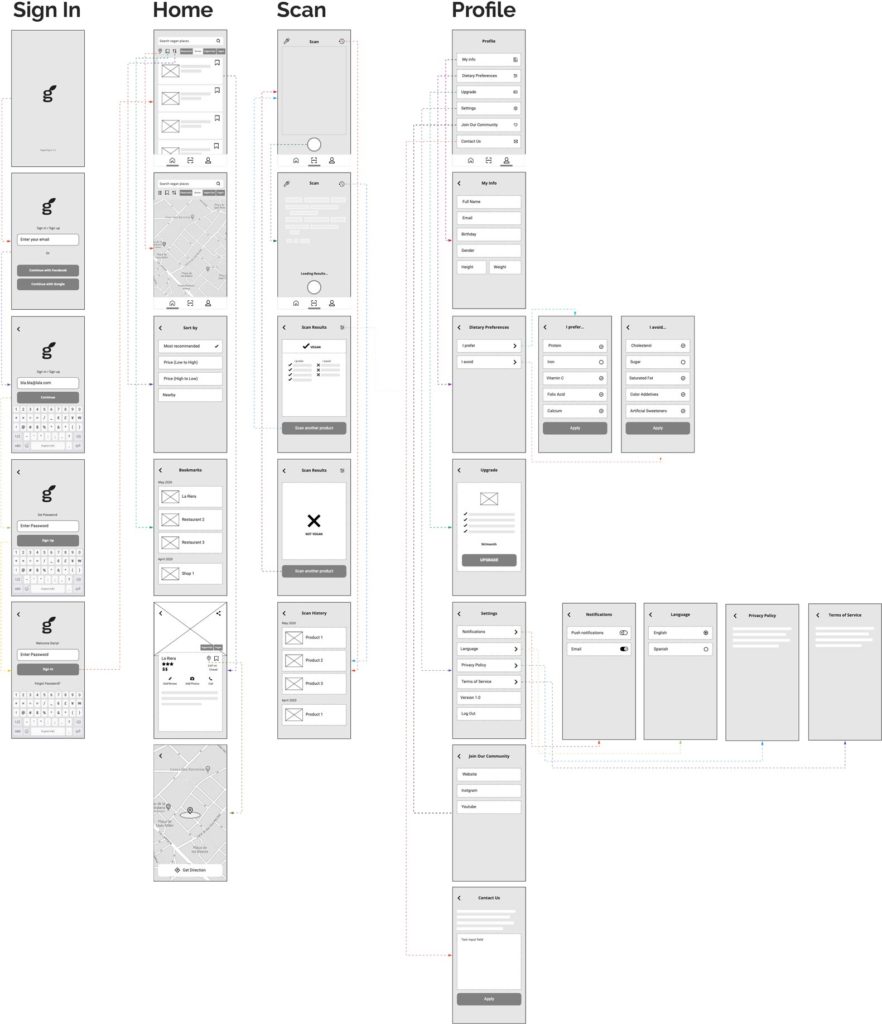
3. UI & Prototyping
3.0.1 Wireflow (Medium fidelity wireframes)
3.1 Vegan Food Discovery
PAIN POINT: “It’s hard to find really good vegan restaurants and stores.”
3.2 Socializing With Non-Vegans
PAIN POINT: “Eating out with my non-vegan friends is challenging because I’m often not sure if a restaurant offers vegan options.”
SOLUTION: ‘Vegan Friendly’ filter is for non-vegan restaurants and stores that also offer vegan meals or products.
3.3 Nutrients Filter
PAIN POINT: “I spend too much time on finding vegan products with the right nutrients at the store.”
SOLUTION: As the research revealed, many vegans, vegetarians, and flexitarians are avoiding (besides animal products) other specific ingredients such as allergens, lactose, or gluten as well. Moreover, our average user would like to increase the intake of good ingredients. Despite the scanning feature was initially imagined as a simple detector of animal ingredients in a product, the insights above led us to the customizable ingredient/nutrition list, with preferences and avoidance.

4. Validation
We tested our product’s usability based on the following factors:
Satisfaction | Effectiveness | Ease of use
The age range of our participants in this user testing was 25 – 35. We used Lookback as a primary tool to conduct remote user testing and Xtensio to generate the testing report in a well-structured format. In addition, we used UsabilityHub to conduct A/B testing.
Key Findings
- The majority of participants understood the general premise of VeganTag Android application.
- Approximately 80% of the participants managed to accomplish the assigned task successfully.
- All the key features received positive feedback from the users.
Reflections
During the initial stage of the solution development, we analyzed the potential of the NFC tag and QR code for the ingredient scanning feature. However, both solutions came out as extremely difficult and costly to implement, since both require embedding chip/code on every vegan product in collaboration with producers. Therefore, we considered switching to a feasible alternate solution, such as OCR (Optical Character Recognition). It is a widespread technology, used to convert virtually any kind of images containing written text into machine-readable text inputs. The final version of VeganTag app uses OCR for the ingredient scanning feature.
Thank you for scrolling! 🍍